

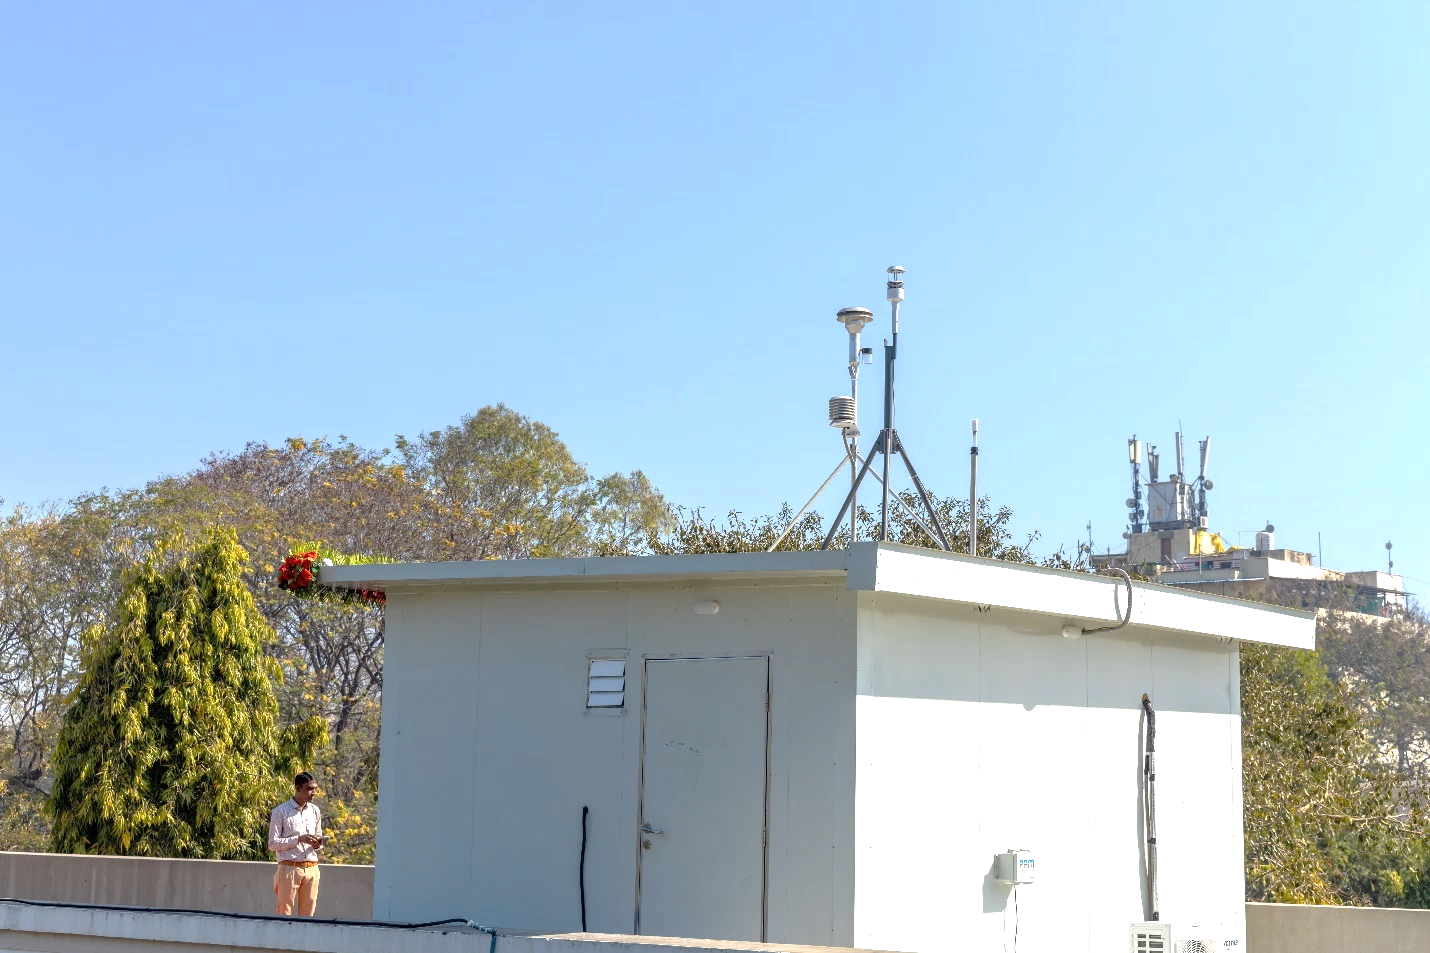
Research around the world shows that pollution levels can vary enormously within the same city and even within the same neighborhood. Local monitoring data can thus prove essential to understanding air pollution sources, how they affect different communities and groups, and where to target policy solutions. That’s why Clean Air Catalyst launched three air quality monitoring stations in Indore in January 2023. These new stations have significantly improved the city’s air quality tracking capabilities in some important ways:
- Nearly doubled the total number of operational monitoring stations in the city prior to January 2023, taking the total number of stations from four to seven.
- Covers new areas, including lower-income neighborhoods, where air quality monitoring was not previously available.
- Measures air quality on a continuous basis. Most preexisting stations in Indore collected data less frequently.
- Enhanced the city’s ability to monitor meteorological trends that impact air quality, such as wind direction and speed, temperature, relative humidity and barometric pressure.
- Expanded coverage of lesser-known pollutants, especially black carbon, which was previously not tracked by preexisting monitoring stations.
Publicly available air quality data is an essential first step toward cleaner air and better health. These new capabilities are equipping Indore’s leaders and residents to reveal this largely invisible threat like never before.
Clean Air Catalyst published a report earlier this year analyzing the 2023 data collected by its three new stations*, in addition to data from a fourth continuous monitoring station set up by the Madhya Pradesh Pollution Control Board in 2019. In this blog, we break down six of the most fascinating insights found in the report and what they can tell us about ways to alleviate Indore’s air pollution.
1) New Stations Expand Access to Air Quality Monitoring in Indore
Prior to the arrival of the three new monitors installed by Clean Air Catalyst (shown on the map in light blue), four state-run air quality monitoring stations were present in Indore. The newest of those, the continuous station (shown on the map as a dark blue dot) is included in Clean Air Catalyst analysis and was set up in late 2019. As the map above shows, the state-run stations (shown in yellow and dark blue) are concentrated in Indore’s urban center and in peri-urban communities to the north.
While the preexisting stations formed a critical foundation of monitoring capacity, they left many communities—particularly densely populated areas to the south and east—without monitoring. The new stations go a long way toward filling those gaps. In choosing where to locate the new stations, city leaders, with support from Clean Air Catalyst, prioritized not only geographic diversity, but also diversity of neighborhoods by level of income and urbanization. With these considerations in mind, they placed one station in an urban site, one in a peri-urban site and one in a low-income residential site. These site choices reflect a core value: to focus on previously overlooked groups.
2) Air Pollution Levels Surpassed National Standards for Most of 2023
Clean Air Catalyst’s analysis found that average monthly levels of fine particulate matter (PM2.5) recorded by all four stations surpassed India’s national daily standard (60 micrograms/m3) for more than a third of the days in 2023. Monthly PM2.5 levels also far exceeded the World Health Organization’s more stringent 24-hour average guideline (15 micrograms/m3) for nearly all of 2023. These results align with trends recorded by preexisting monitors and observed in other cities across the region.
Exposure to consistent, unsafe air pollution levels increases the risk of serious health conditions at all ages. Air pollution also worsens health among those with existing diseases and disproportionately affects vulnerable groups more likely to be exposed such as women and low-income residents. By taking action to reduce air pollution year-round, Indore’s leaders can significantly improve the health and safety of its residents.
3) Air Pollution Levels Are More Than Three Times Higher in Winter Than in Monsoon Season
Across all four station sites, PM2.5 levels were highest during the winter and post-monsoon seasons and lowest during the monsoon and pre-monsoon seasons. Seasonal average PM2.5 concentrations breached the 60 micrograms/m3 national daily health standard for about 80% of observed days during the winter and post-monsoon months and for about 20% of days during the summer months. During the monsoon season, the daily average PM2.5 levels were at their safest, with only one day surpassing the 60 micrograms/m3 standard.
Seasonal variations in air pollution are likely due to the combined effects of changing emissions and weather patterns. During colder seasons, residents burn more firewood, coal and other fuel sources to stay warm, driving up local emissions. Meanwhile, reduced wind and rain in those seasons result in pollution being less likely to disperse quickly, thus allowing it to become more concentrated. Understanding these seasonal trends will help the city target source-specific solutions during seasons when air pollution is highest.
4) Air Pollution Levels Peak During Morning and Evening Traffic Surges
For most of the year, most monitoring stations detected significant spikes in PM2.5 levels during morning (peaking around 8:00 a.m.) and evening hours (peaking around 8:00 p.m.) Following the previous insight about seasonal variation, these spikes were consistently highest during the winter and post-monsoon seasons and almost non-existent in the monsoon season. They were more pronounced at the urban and peri-urban sites, which were likely to experience heavy traffic congestion at these rush hour times.
These time-of-day trends suggest that the transportation sector is likely a chief contributor to Indore’s air pollution. They underscore the potential importance of policies that can help alleviate congestion and vehicular emissions, such as low-emission zones, expansion of public transportation and expediting the city’s transition to electric vehicles.
5) Air Quality in Indore is Heavily Impacted by Wind
All four stations observed clear patterns in PM2.5 levels at varying wind speeds, measured in kilometers per hour. At the low-income residential site for example, PM2.5 levels were consistently higher during slower wind speeds, as depicted in the graphic above.
Because air pollution—especially from local sources like transportation—is continuously emitted, wind can play an important role in dispersing pollutants and keeping them from accumulating in the air. In times when winds are lower, air pollution tends to disperse more slowly, which can drive up PM2.5 levels. Wind can also play a role in transporting external air pollution in and out of the city. These insights, along with others on seasonal and time-of-day trends, can help residents make informed decisions about when to stay indoors.
6) CO Levels in Indore’s Busiest Areas Breached Safety Limits
The new monitoring station at the urban site is equipped with instruments that measure concentrations of two other pollutants commonly released during the burning of fossil fuels: black carbon (BC) and carbon monoxide (CO). These pollutants are linked to many of the same health impacts as PM2.5 but have received less attention.
As the graphic above illustrates, the station observed similar seasonal and hourly trends for CO as it did for PM2.5, with concentrations soaring during the winter and post-monsoon months. CO levels even breached national safety standards (4 mg/m³ per hour of exposure) in the evening during those higher-risk seasons, likely due to elevated vehicular activity. While the urban site station collected data on CO concentrations for more than 95% of 2023, it was unable to collect consistent BC data due to instrument issues. We hope to examine BC after more data becomes available.
These revelations underscore the many layers of risk exposure brought on by transport-related pollution, particularly on Indore’s busiest streets. Better access to data on CO and BC can help city and state officials capture a more complete picture of the range of pollutants that threaten the health of residents.
Next Steps: From Data to Insights to Action
These new data and insights represent a powerful tool for Indore’s policymakers: They can help the city craft interventions that deliver greater air quality improvements per dollar spent, target major air pollution sources with greater precision and prioritize vulnerable communities. City leaders are committed to continue expanding monitoring coverage as well, having brought four additional continuous monitoring stations online since the start of 2024.
The data showcased here, along with insights from other Clean Air Catalyst research, such as our forthcoming emissions inventory, forms a solid basis for informed clean air action. Moving ahead, Clean Air Catalyst will continue aiding Indore on its journey towards cleaner, healthier air by supporting the continued expansion of monitoring, offering transparent analysis and collaborating with cross-sector leaders to design solutions.
*Note that the insights shared here are based on preliminary data that may be subject to revision.
Clean Air Catalyst is a flagship program launched by the U.S. Agency for International Development and a global partnership of organizations led by WRI and Environmental Defense Fund, Inc. We are focused on building capacity for locally tailored solutions that curb air pollution, tackle climate change and improve human health.
A version of this article originally appeared on CleanAirCatalyst.org.
Derek Schwabe is Communications Manager of Global Clean Air at Environmental Defense Fund.
