


The Eden Center in Falls Church is the center of D.C.'s Vietnamese community. Photo by mj*laflaca.
Joel Kotkin and his website New Geography can be frustrating—Kotkin can be an apologist for sprawl—but they can also be invaluable. That latter quality was on full display today in Prof. Ali Modarres’ expert breakdown of census data showing that both nationally and in California, immigrant populations use significantly more sustainable transportation than the native-born population does. Here are his numbers:
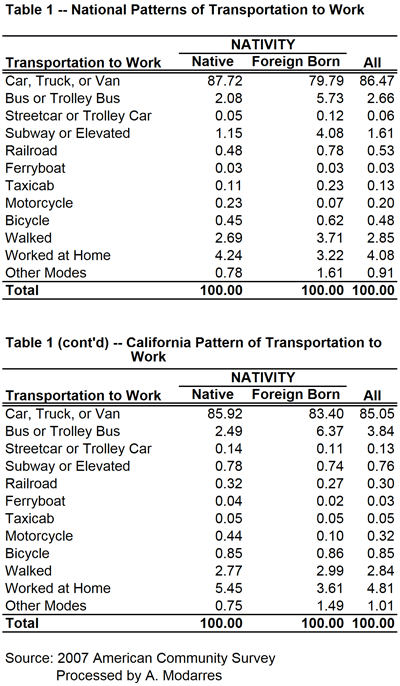
In Modarres’ words, “Immigrants, in essence, are doing precisely what planners want the rest of us to do.”
This kind of demographic breakdown of transportation use is incredibly important for creating policy. It’s too easy in transportation policy to think only in terms of where, but not who. As a result, I thought I’d head over to the Census and see if the same patterns appeared in the D.C. region. I couldn’t find the exact data set that Modarres used, so I retooled his data to match the less finely grained data that I could find (American Community Survey, 2007 data, series B08111), giving me the following three tables:
| National | Native-Born | Foreign-Born | All |
| Car |
87.72 |
79.79 |
86.47 |
| Public Transport |
3.79 |
10.74 |
4.89 |
| Taxi, Bike, Motorcycle, Other |
1.57 |
2.53 |
1.72 |
| Walked |
2.69 |
3.71 |
2.85 |
| Worked at Home |
4.24 |
3.22 |
4.08 |
| California | Native-Born | Foreign-Born | All |
| Car |
85.92 |
83.4 |
85.05 |
| Public Transport |
3.77 |
7.51 |
5.06 |
| Taxi, Bike, Motorcycle, Other |
2.09 |
2.5 |
2.23 |
| Walked |
2.77 |
2.99 |
2.84 |
| Worked at Home |
5.45 |
3.61 |
4.81 |
| D.C. Area | Native-Born | Foreign-Born | Total |
| Car |
77.94 |
78.43 |
78.06 |
| Public transportation |
13.27 |
13.51 |
13.34 |
| Bikes, taxis, motorcycles, other |
1.17 |
1.33 |
1.21 |
| Walked |
3.00 |
2.84 |
2.96 |
| Worked from Home |
4.62 |
3.89 |
4.43 |
As you can see, while nationally, transit use is almost three times higher among immigrants, and is twice as high among immigrants in California, here in D.C. the numbers are identical. In fact, the only really significant difference between foreign- and native-born populations transportation in this region is that more native-born workers work from home.
There are three primary explanations for this. First, the D.C. area is one of many where new immigrants move not to the city but to outlying suburbs. This is a major national trend, but it is particularly true here. It’s well-known that the good Asian food in the region is in Maryland and especially Virginia and usually not transit-accessible. On the other hand, Southern California, at least, probably has an especially high portion of its immigrant population locate within the cities—think East L.A. This difference puts more immigrants near more transit in California than in D.C.
The second explanation is that the D.C. area has very high transit ridership, and exceedingly high rail ridership. BART and L.A.’s Metro Rail together have just over half the yearly riders of D.C.’s Metrorail. Those extra riders usually come from the top of the socioeconomic ladder. Given that the native-born population out-earns the immigrant population, more riders means more wealthy riders means more non-immigrant riders, on average.
Finally, comparing California to the D.C. region isn’t apples-to-apples. One is a state and one is a metropolitan region. These numbers might look very different in the Bay Area, for example. That said, the metropolitan areas of Southern California, the Bay Area and San Diego account for over ¾ of California’s population, so differences in the ways immigrants commute might still come across somewhat in the data.
Regardless, that native- and foreign-born populations would travel to work nearly identically (once you lump the bus and the subway together) isn’t an intuitive finding; it’s sharply at odds with the national average. D.C. is one of the fastest-growing destinations for new immigrants. Regional officials are going to have to develop strategies that take this into account. Exploring the different ways that immigrant populations—separate from low-income populations or non-white populations—interact with our transportation system is going to be an important project for regional planners. Hopefully this is an opening to that conversation.

